Math graphic organizers help elementary students solve word problems, find common factors or the greatest common divisor, and even assess probabilities.
Factor Trees
The tree is a math graphic organizer that can help students take a large number and find its factors. The tree starts with a large rectangle or oval at the top of the page. Then two lines, or branches, are drawn with either smaller rectangles or ovals at the ends of the lines. Next, two lines are drawn from each of these smaller shapes, so that you have drawn a total of four lines on this level of the tree. At the end of each of these lines are drawn smaller shapes again. You can continue in this way as long as you need to, depending on the math problem that needs to be solved.
Here’s an example of a problem where you would use this math graphic organizer. You are trying to find the lowest factors of 100, so you put 100 in the top box. In the next level of the tree, you put 4 in one box and 25 in the other (4x25). In the third level, 2, 2, 5, and 5 go in the boxes because (2x2=4) and (5x5=25). Now with the factor tree, you’ve found that 2x2x5x5 equals 100.
Venn Diagrams
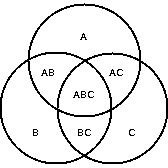
Another popular type of math graphic organizers are Venn diagrams. Students can use Venn diagrams that have two circles to compare two numbers or objects or three circles to compare three numbers or objects. Children can solve word problems with Venn diagrams, find common factors, and compare or contrast three dimensional shapes. For example, let’s stay students have to find the least common factor of 100, 250, and 375. They list one of these numbers in each circle of the Venn diagram, and then they start writing factors. If the factors are common with all three numbers like 5 is, then students would write 5 in the section where all three circles connect. If a factor, like 2, only fits with two of the numbers, then it is written in the section where 100 and 250 intersect. When students have gone through all the possible factors of the numbers, this math graphic organizer will show them the least common factor in the middle section.
Charts
Charts are useful as math graphic organizers when students are learning math facts, finding fact families, or want to see a pattern in their math tables. For example, you can have a chart that has 5 columns. The columns are labeled like this: a + b = c, then students can work on addition facts, and place numbers in the chart such as: 3 + 1 = 4; 3 + 2 = 5, and so on. Students can see that as the number in the b column increases by one, so does the answer column if “a” remains the same.
These charts may also be useful when students are solving a guess and check word problem such as, “Martha and John have 20 marbles. Martha has 10 more than John. How many marbles do they each have?” Students can plug numbers into the chart until they find the correct combination and solve the problem.
Math graphic organizers make math simpler for many students!
This post is part of the series: Graphic Organizers for everyone!
Here are graphic organizers for all types of activities!