Just what is a Venn Diagram graphic organizer, and how can it be used? We cover Venn basics and discuss the 2 circle and 3 circle varieties.
The Venn Diagram
Venn Diagrams are handy tools when you are trying to compare and contrast two or more topics. They can be used in classrooms as an aid to almost any subject. In English, you might want to compare/contrast two novels or characters. In history you might be interested in three different time periods, and in math you could look at multiple ways of solving the same type of problem.
Creating a Venn Diagram graphic organizer is simple and quick, and involves drawing two or more overlapping circles. The parts of the circles that overlap illustrate common points between the items or subjects you are looking at, while parts of the circles that do not overlap illustrate what is unique to one of the subjects. The two most common types of Venn Diagrams are the 2-circle and 3-circle versions.
The 2 Circle Venn Diagram
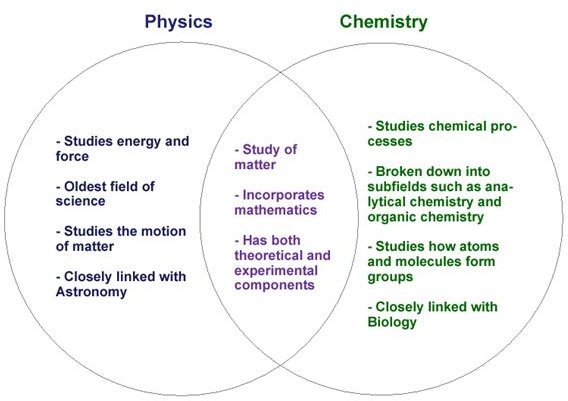
This is the basic, most simple version of this graphic organizer. You draw two circles so that they overlap with each other, creating three separate areas. Label each circle with the name of something you want to compare and contrast. So if you are interested in the similarities and differences between two major fields of science, you might label the first circle “Physics” and the second circle “Chemistry.”
The part of the first circle that does not overlap with the second is meant for information that only applies to the first concept. So in our example, this first section would be home to what is unique to physics, such as a focus on energy and force and the fact that it is one of the oldest (if not the oldest) scientific disciplines. The part of the second circle that does not overlap with the first is reserved for information unique to the second concept. So we might include that chemistry focuses on chemical processes, and looks at how matter forms to become molecules and crystals.
The section in the middle of the Venn Diagram graphic organizer, where the two circles overlap, is for those things both subjects have in common. Both physics and chemistry are natural sciences, are involved in the study of matter, and have both theoretical and experimental components, so we would write these facts in the overlapping section. You can see a completed example of this 2 circle Venn Diagram here .
The 3 Circle Venn Diagram
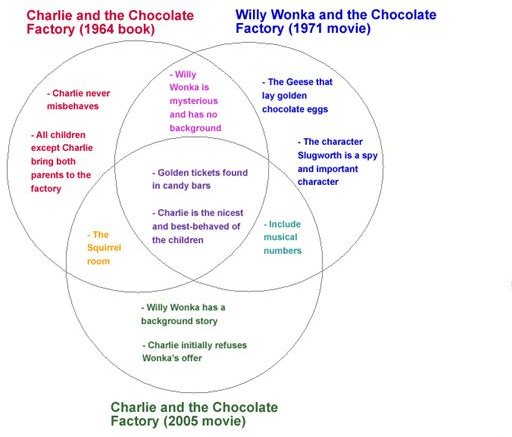
This version of the Venn Diagram graphic organizer uses the same concept as the two-circle variety, only with (surprise!) three circles. This makes things a little more complicated, because now the diagram has seven sections instead of three. Say we call our three circles “Charlie and the Chocolate Factory (1964 book),” Willy Wonka and the Chocolate Factory (1971 movie),” and “Charlie and the Chocolate Factory (2005 movie).” Three of the sections will be non-overlapping, and so are reserved for information only applicable to that particular book or movie. The 2005 movie is the only one with a background story for the character of Willy Wonka, so that fact would be placed in the non-overlapping part of the third circle.
Then there are three sections where two circles overlap. This is where we would put facts that are true about two of the stories, but not the third. Both the book and the 2005 movie have a scene involving squirrels, while the 1971 movie does not, so that information would go in the section where the book and 2005 circles overlap. And finally, the center section is where all three circles overlap, so it is where we would put facts applicable to all three stories. Both movies and the book begin with the search for golden tickets hidden in candy bars, so we would put that information in the center section. You can see a completed example of this 3 circle Venn Diagram here .
Using the Venn Diagram
Venn Diagrams are simple to make, and have a variety of uses. Teachers can use them in class to help students grasp the similarities and differences of topics they are studying, either as a solo or group activity. Students can also make their own Venn Diagrams as a study aide, to help make sure they have a grasp on the most important concepts. Finally, the Venn Diagram can be a helpful pre-writing activity for those who need to write compare and contrast essays . The Venn Diagram graphic organizer is a great way to engage and help those students who learn best visually, and helps to organize your thoughts even on the most complex of topics.