Begin the year by teaching your students about the many ways to present the data they have collected. Then continue using the information throughout the year by adding a question of the day in your morning routine. Here you will find some great graphing ideas!
Graphs are used to present information in a simple and easy way. So easy that little ones will quickly be able to interpret the data by looking at a graph. Soon they will understand how to “read” a graph in a variety of formats. Then they will use concepts of comparing and contrasting information easily. You can incorporate a simple graph in your morning routine every day or once a week. Students will delight in gathering information and learning more about themselves and others.
Objectives:
1. Students will collect and sort data about everyday situations and familiar objects; e.g., data collected from simple surveys (favorite colors, favorite sandwich, holidays, pets) and data collected over a period of time (daily weather).
2. Students will learn to represent data in a variety of graphs using objects and pictures; e.g., bar graphs, picture graphs, pie charts.
Materials:
- Student nametags with a magnet strip on the back to be used all year
- Magnetic white board
- Book: Chrysanthemum by by Kevin Henkes
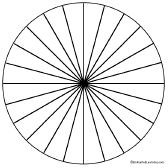
- One copy of the pie chart
- Create a Picture Graph Download
- Make a Graph Download
Procedure Day One
At the beginning of the year one of the first things we assess is how many children know the basic colors. Choose four of the most common colors (red, blue, green, yellow) and write them across the top of the white board. You may want to use a red marker to write red, blue marker to write blue and so on. Then pass out the nametags to each student.
Tell students, “If you were going to buy a car and you only had these four color choices, which color would you choose?” Ask students to choose a color they really want and not just because their best friends chose the color. Then one-by-one the students can place their magnetic nametags under their color choice in a vertical row. When completed, tell them that they have just made a graph. Explain that a graph gives them information without using a lot of words.
Ask:
- Which color was the most liked or most popular? How do you know?
- Which was the least popular?
- Were there any colors that no one picked?
- If we place the information in horizontal rows, would it still give the same results?
Explain that graphs can come in many forms. Now we are going to do a human graph! Look at the students clothing and decide if you are going to graph the color of shirts, socks or pants. Let’s suppose you choose shirts. Ask the students to join other students who have the same shirt color. When they are settled in the right group ask them to line up within the group.
Ask:
- Which line is longest?
- What does that tell us?
- Which line is shortest?
Procedure Day Two
Read the book Chrysanthemum to your students. The main character, Chrysanthemum, loves her name until she gets to school. The children tease her because it is too long. After reading and discussing the book it’s time for a graph! Write the numbers 2 through 14 across the top of the magnetic white board. Ask the students to count the amount of letters in their first names. One-by- one students should place their magnetic nametags under the number representing the amount of letters in their names.
Ask:
- What is the most common amount of letters?
- Who has the shortest name?
- Who has the longest name?
You may choose to repeat the activity using the last names of the students.
Assign homework: Printable worksheet for the students to create a picture graph of the number of three items in their houses. Show an example when giving the assignment.
Procedure Day Three
Today we will gather information and put the data on a pie chart. (Use the provided printable) This is to illustrate to the students that data can be compiled in a variety of forms. Provide each student with a small piece of paper and ask each student to write his or her favorite color on the paper secretly, fold it and hand it to you. You may want to list eight choices on the board. Quickly sort the votes into piles of like colors. Gather the students around you and color the pie chart using the crayon with the same color as the vote. Color one section for each vote. Keep the same colors together. When completed ask:
- Looking at the pie chart, which color do you think is the most popular or well liked? Why?
- Which color is the least popular?
- Why do you think this is called a pie chart?
- What other ways could we have shown the information?
Year Round Ideas:
1.Use a large monthly calendar and draw a simple symbol of the weather for each day (cloud, rain, snowman, sun) At the end of each month discuss the data on the calendar. Were there more sunny days or cloudy days? How many rainy days?
2. Graph the daily lunch count in two columns (Buying lunch or packed lunch) by using the students’ magnetic nametags. Student moves his or her nametag to the appropriate column when they enter the classroom each morning.
3. Make a graph using dowel rods, clay, a wooden block and wooden beads. (Download the illustration and directions )
4. Suggestions for daily graphing:
- students’ eye colors
- favorite sandwich
- favorite holiday
- animals sorted by fur, fins or feathers
- favorite TV show
- favorite type of pet
- favorite Dr. Seuss book
- months of students’ birthdays
- types of fall leaves
5. Tie in graphing questions to what you are studying in Social Studies, Science and Language Arts!
References
- Henkes, Kevin. Chrysanthemum. Greenwillow Books, 1991.