Give students practice determining proportionality of shapes by using a table to compare ratios.
Objective
Students will identify proportional shapes by creating ratios and making a table to test the proportionality of the ratios.
CCSS.MATH.CONTENT.7.RP.A.2.A
Decide whether two quantities are in a proportional relationship, e.g., by testing for equivalent ratios in a table or graphing on a coordinate plane and observing whether the graph is a straight line through the origin.
Materials
- Rulers
- Paper
- Pencils
- Colored Pencils (2 Colors Per Student)
Lesson Procedure
Note: students should be comfortable using Greatest Common Factor to reduce fractions to lowest terms for this activity.
Step One: Introduction of proportional shapes
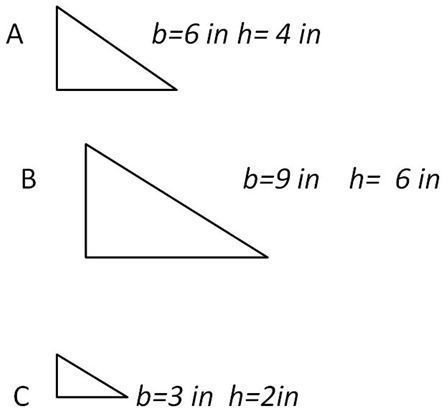
Introduce the concept of proportional shapes by drawing and measuring the dimensions (base and height) of triangles on the board, making ratios and cross-multiplying to prove their proportionality. For example, teacher may draw triangles with the following dimensions:
Demonstrate the ratio of base to height for each triangle:
A) 6:4
B) 9:6
C) 3:2
Show students how to put the ratios into a table:
For this exercise, to determine proportionality, students will use the Greatest Common Factor (GCF) to reduce the ratios in the table to lowest terms; if the lowest term (simplest form) is the same for all the ratios in the table, the ratios are proportional.
Because the lowest terms all match, the ratios in the table are proportional.
Step Two: Investigation
Give students a pre-determined set of measurements for various triangles (base and height). You may want to include a few measurements that are not proportional in order to give students the opportunity to notice the difference between proportional and non-proportional sets of ratios.
Note: if students need more guidance, this step should be completed whole class with one set of numbers. If students need less guidance, you may want to let them work with partners with their own unique sets of measurements.
Using their rulers, students will draw out the triangles according to the given measurements (optional depending on time—students can use different colored pencils to mark the base and height of the triangles). Students will then create a table to record the measurements for the base and height of each triangle.
Sample Table
Lowest terms for triangles A, B and D: 3/4
(Triangle C is not proportional, as its simplest form is ½).
Step Three: Reflection
Ask students to reflect on the activity by discussing or writing about the following topics:
- What are the advantages and disadvantages of using a table to see if ratios are proportional?
-
When might it be useful to have a table as a visual reference for ratios?
-
What are some other methods students can use to determine the proportionality of ratios?
Assessment
Ask students to analyze a table with given ratios to determine whether the ratios in the table are proportional to each other and explain their reasoning.
Extension
Give students a hands-on activity to practice making a ratio table, such as counting candies in packages, pencils in desks, or pockets on pants. Allow students to determine scenarios in which ratios are likely or unlikely to be proportional to each other.