Let students get hands-on experience collecting, recording, and displaying data with box and whisker plots!
**
Objective: Students will apply the skill of using box and whisker plots to display collected data.
CCSS.Math.Content.6.SP.B.4: Display numerical data in plots on a number line, including dot plots, histograms, and box plots.
Materials: Individual packets of sunflower seeds, paper, pencils, graph paper and rulers
Note: Students should have previous experience with finding the median of a set of data for this activity.
Lesson Procedure
Step One: Introduction and Recording of Data
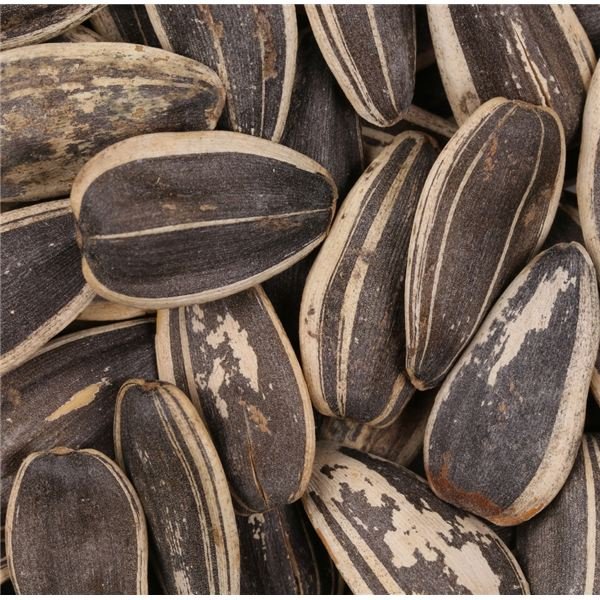
Distribute individual gardening packets of sunflower seeds (packets should ideally only have about 20 seeds or so). Have students open their packets and begin counting their sunflower seeds, writing the number of seeds down at the top of their papers.
Once students have finished counting, record the numbers of seeds in student packets, ordering the numbers from least to greatest as they are given. As a class, students should record the numbers on their own papers, and find the median of the numbers once the entire set of data is listed.
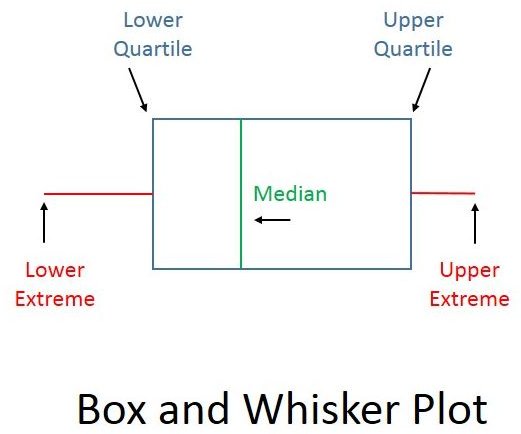
Step Two: Introduction to Box and Whisker Plots and Display of Collected Data
Ask students to create a number line to show the data. Once the number line is created, have students draw a vertical line to show the median. Next, ask your students to divide the data into quartiles by using the following method:
1. Find the median of the lower half of the data (lower quartile).
2. Find the median of the upper half of the data (upper quartile).
Note: If there is an even number of data elements, students will need to average the two numbers in the middle of the set of data to find the median.
Students should draw vertical lines at the upper and lower quartiles. Then, ask students to make a dot above the lower extreme (the lowest number of sunflower seeds) and the upper extreme (the highest number of sunflower seeds). Students should complete the “box and whisker” part of the graph by enclosing the quartiles (making a box) and drawing horizontal lines from the lower and upper quartiles to the lower and upper extremes (making “whiskers”).
Step Three: Conclusion of Lesson
Discuss with students when box and whisker plots might be useful, and pose the following questions:
- Can you estimate about how many sunflower seeds you would expect to get in a packet by looking at the graph?
- What is the least amount of seeds you would expect to get?
- What is the highest amount of seeds you would expect to get?
- Why do you think there is close range in number of how many seeds are in each packet?
Spend some time allowing students to discuss their analyses of the data they have collected and displayed, so they get practice analyzing box and whisker plots for information.
To give students practice with making box and whisker plots, you may want to distribute a sheet with sample sets of data (such as numbers of seeds in different types of flower packets) and ask them to work with partners or independently to create box and whisker plots to show the data.
Assessment: Quiz students on the basics of a box and whisker plot, such as median, upper and lower quartile, upper and lower extreme, and range of data.
Extension: Give students the opportunity to compare box and whisker plots with other methods of displaying data, such as histograms and dot plots, by distributing sets of data and asking students to use all three methods to display the data.
References
- Sunflower seeds: PhotoSpin