Organize, represent and interpret data? That sounds too technical! Actually it can be simple and fun for your young students. You can even include this in your daily morning routine. The main thing to do is to think of an engaging kid-oriented subject and you will grab students’ attention.
Interpreting data is an objective in the Common Core Standards. The standards emphasize in-depth thinking. Working with data allows students to reinforce their skills in counting, comparing, communicating and justifying their thinking.
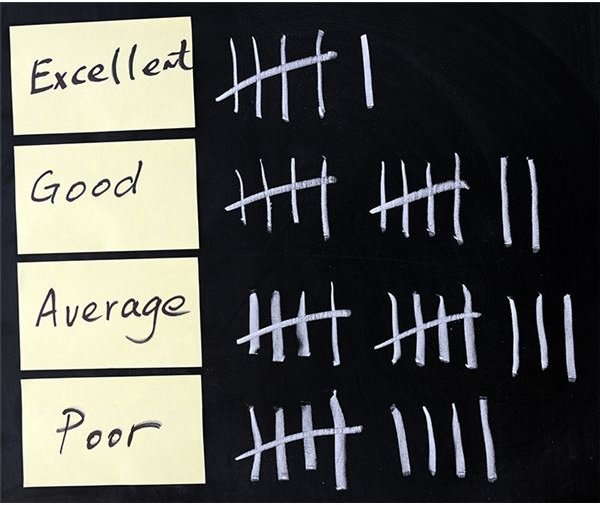
Today we are going to learn how to use tally marks when gathering data on a particular subject. This is a simple and useful skill that kids will use forever.
Objectives:
- Organize, represent and interpret data with up to three categories: ask and answer questions about the total number of data points, how many in each category, and how many more or less are in one category than in another. MA1-MD-4
- Use tally marks on a graph and interpret the results.
- Attend to precision: As young children begin to develop their mathematical communication skills, they try to use clear and precise language in their discussions with others and when they explain their own reasoning. MP.6
Vocabulary:
It is important to use the correct math terminology even with your young students as you engage in math conversations.
- Data
- Tally chart
- More
- Less
- Total
- Category
- Bar graph
Materials:
- Student copies of worksheet (downloadable)
- Chalk board, white board or similar
- Pencils and crayons
Prior Knowledge: Students should be able to count by ones and fives to 100.
Lesson Procedure
1. Gather students together and say, “Today we are going to gather some information and make a tally chart. Tally marks are marks meaning a number. For example, if I had three apples I will make 3 tally marks to represent the three apples."
(Demonstrate on the board.)
“Let’s suppose that I counted everyone in the class (example might be twenty-six students) and put a tally mark for each student. To make it easier to count we put a slanted line for every five we are counting.”
(Demonstrate on the board)
“Now let’s count: five, ten, fifteen, twenty, twenty-five, and one more makes twenty-six.”

2. Next, draw a simple graph on the board (just like the one on the worksheet). Say, “We are going to gather data about your favorite ice cream! The three choices are vanilla, chocolate or other. Other in this case means that you have another favorite or that you don’t like ice cream at all. You may only have one choice.
Say, “Stand up if your favorite kind of ice cream is vanilla.” Count the students and make tally marks to represent the number on the tally chart. Do the same for the other two choices.
- “Raise your hand if you know which flavor is the favorite? “
- “What did you need to do to get that answer?”
- “Which flavor has the least amount of tally marks?”
Activity
Give each student a worksheet and have them sit at their seats with a pencil and crayons. Say, “Now we are going to gather data about three farm animals. Write one animal in each box on the left: “pigs”, “cows” and “chickens”.
Then say, “Mr. Green has lots of animals on his farm. You are going to compare the amount of three of the animals. Make tally marks in the right place on your chart with your pencil. He has twelve pigs. (Allow time for students to mark their charts.) He has ten cows. He has twenty-four chickens.
When all the charts are filled in say, “Mr. Green has the most of which animal? Use your green crayon to circle the name of the animal. Mr. Green has the least amount of which animal? Use your red crayon to circle that animal. How many more pigs does he have than cows? Write the number with your blue crayon at the bottom of your paper. Bonus: What is the total amount of pigs, cows and chickens?" (Count the tally marks.)
Extra:
Tally marks can be used all year to collect data and keep scores of games that you play. Use the opportunity to count the tally marks for practice each time.
When collecting data, choose categories of interest to the students. Expand the number of choices in the categories. Ask the students to suggest categories, too.
Some ideas can include: favorite food, book, school subject, zoo animal, pet, color, toy, tv show, game, sport, holiday or even month of students’ birthdays.