Graphing is a problem solving tool. In these interactive data and graphing activities students will work their way from the simple to the more complex. Picture books also present a place to collect data to analyze through graphs.
Keep it Simple
Interactive data and graphing activities begin with simple Real Graphs .
Gather the students together and ask them if they can guess how many of them have bumpy soles on their shoes and how many have smooth soles? After discussion and suggestions, invite the students to take off one shoe each, and place them in one of two columns on the floor with a label for each column - bumpy or smooth. Then have the students look at the two columns and decide which has more. Ask the children to suggest a title for their real graph - Are You Wearing Bumpy Soles or Smooth Soles Today? Print this on a card and put it above the columns. Then ask the students what they have learned about their inquiry. Print Conclusion on another card and print the findings: More children wore smooth soles today.
This is an important step in graphing, as each graph should always have a heading and a conclusion.
Provide many opportunities for students to make Real Graphs. For example: Coats with zippers / Coats with buttons. Jackets with hoods/ Jackets without hoods.
Next Step - Picture Graphs
When students are comfortable with making concrete graphs, it is time to introduce the next step - Picture Graphs.
Explain to the students that it is not always possible to collect the actual objects to make a graph to find out information, and so we can use pictures to represent the real thing. You might begin the investigations by posing the question Who rode to school today? Who walked to school today? Provide each child with two pictures - a car and a pair of feet. On a chart, ask them to choose the correct picture for their mode of transport, and place it in the correct column. Make sure that you add a title: How Did We Travel to School Today? After discussion about the graph, write a Conclusion and add to the chart. To further the activity, you may wish to add another column to this particular graph to include a school bus; this adds another dimension because there is now a choice of three columns.
Offer other scenarios for picture graphing: Favorite foods; Favorite pets; Favorite ice cream flavors; Favorite Smarties or M&M’s colors.
Advanced Step - Symbolic Graphs
After much practice with the concrete and picture graphs, students will be ready to take part in interactive data and graphing activities at
the Symbolic stage.
Explain that we cannot always use concrete materials or pictures to collect data, and that we need to substitute symbols. Begin with a simple two column chart headed Have You Ever Been to Niagara Falls? Label the columns Yes and No. Then demonstrate how we can use an “X” to represent an answer.
The next step is to introduce coloring squares on graph paper. For example : give each student a graph paper with the title Which Do You Like Best? Down the side of the paper give the choices of Apple Pie, Cherry Pie, Peach Pie, Plum Pie. Invite the students to ask their friends the question and color in a square for the answer.
Collect, Organize and Describe Data
Ask your students to keep a tally of the mail that is delivered to their homes over a week. How many letters, advertising flyers, bills, postcards, magazines? At the end of the week make a class bar graph to find out the most received form of mail
Check in the local newspaper for a week to see how many baby boys have been born and how many baby girls have been born. Graph the results.
The Literature Connection
After students are familiar with the various forms of graphing share with them the book: Tiger Math: Learning to Graph from a Baby Tiger by Ann Whitehouse Nagda and Cindy Bickel. This is a delightful book that follows the growth and development of a baby tiger and gives ideas for students to graph its progress.
Carol Otis Hurst writes “Many picture books inspire interest in new topics. As you gather information, look for ways that you can organize your information and compare it. Seize opportunities to tabulate findings, graph results, and manipulate the information you find”
As you can see, by utilizing interactive data and graphing activities, students can organize, analyze and investigate problems and learn how to draw conclusions.
References
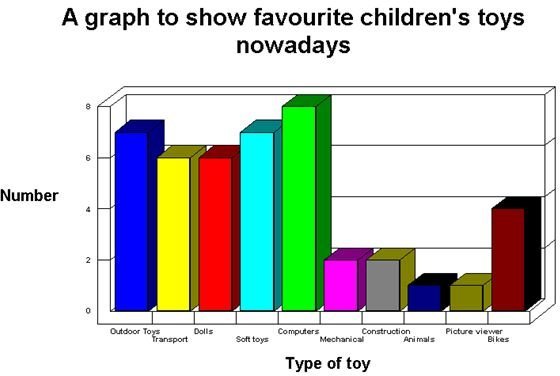
Picture: https://www.amblesideprimary.com/ambleweb/toygraphs/index.htm
Quote: Hurst, Carol Otis. Picturing Math . Publisher McGraw Hill. 1996